Real-time analytics
Memory Dashboard
A real-time window into everything your agents know. Interactive knowledge graphs, semantic search, drift detection, and collection analytics — built on FastAPI, HTMX, D3.js, and Chart.js.
A real-time window into everything your agents know. Interactive knowledge graphs, semantic search, drift detection, and collection analytics — built on FastAPI, HTMX, D3.js, and Chart.js.
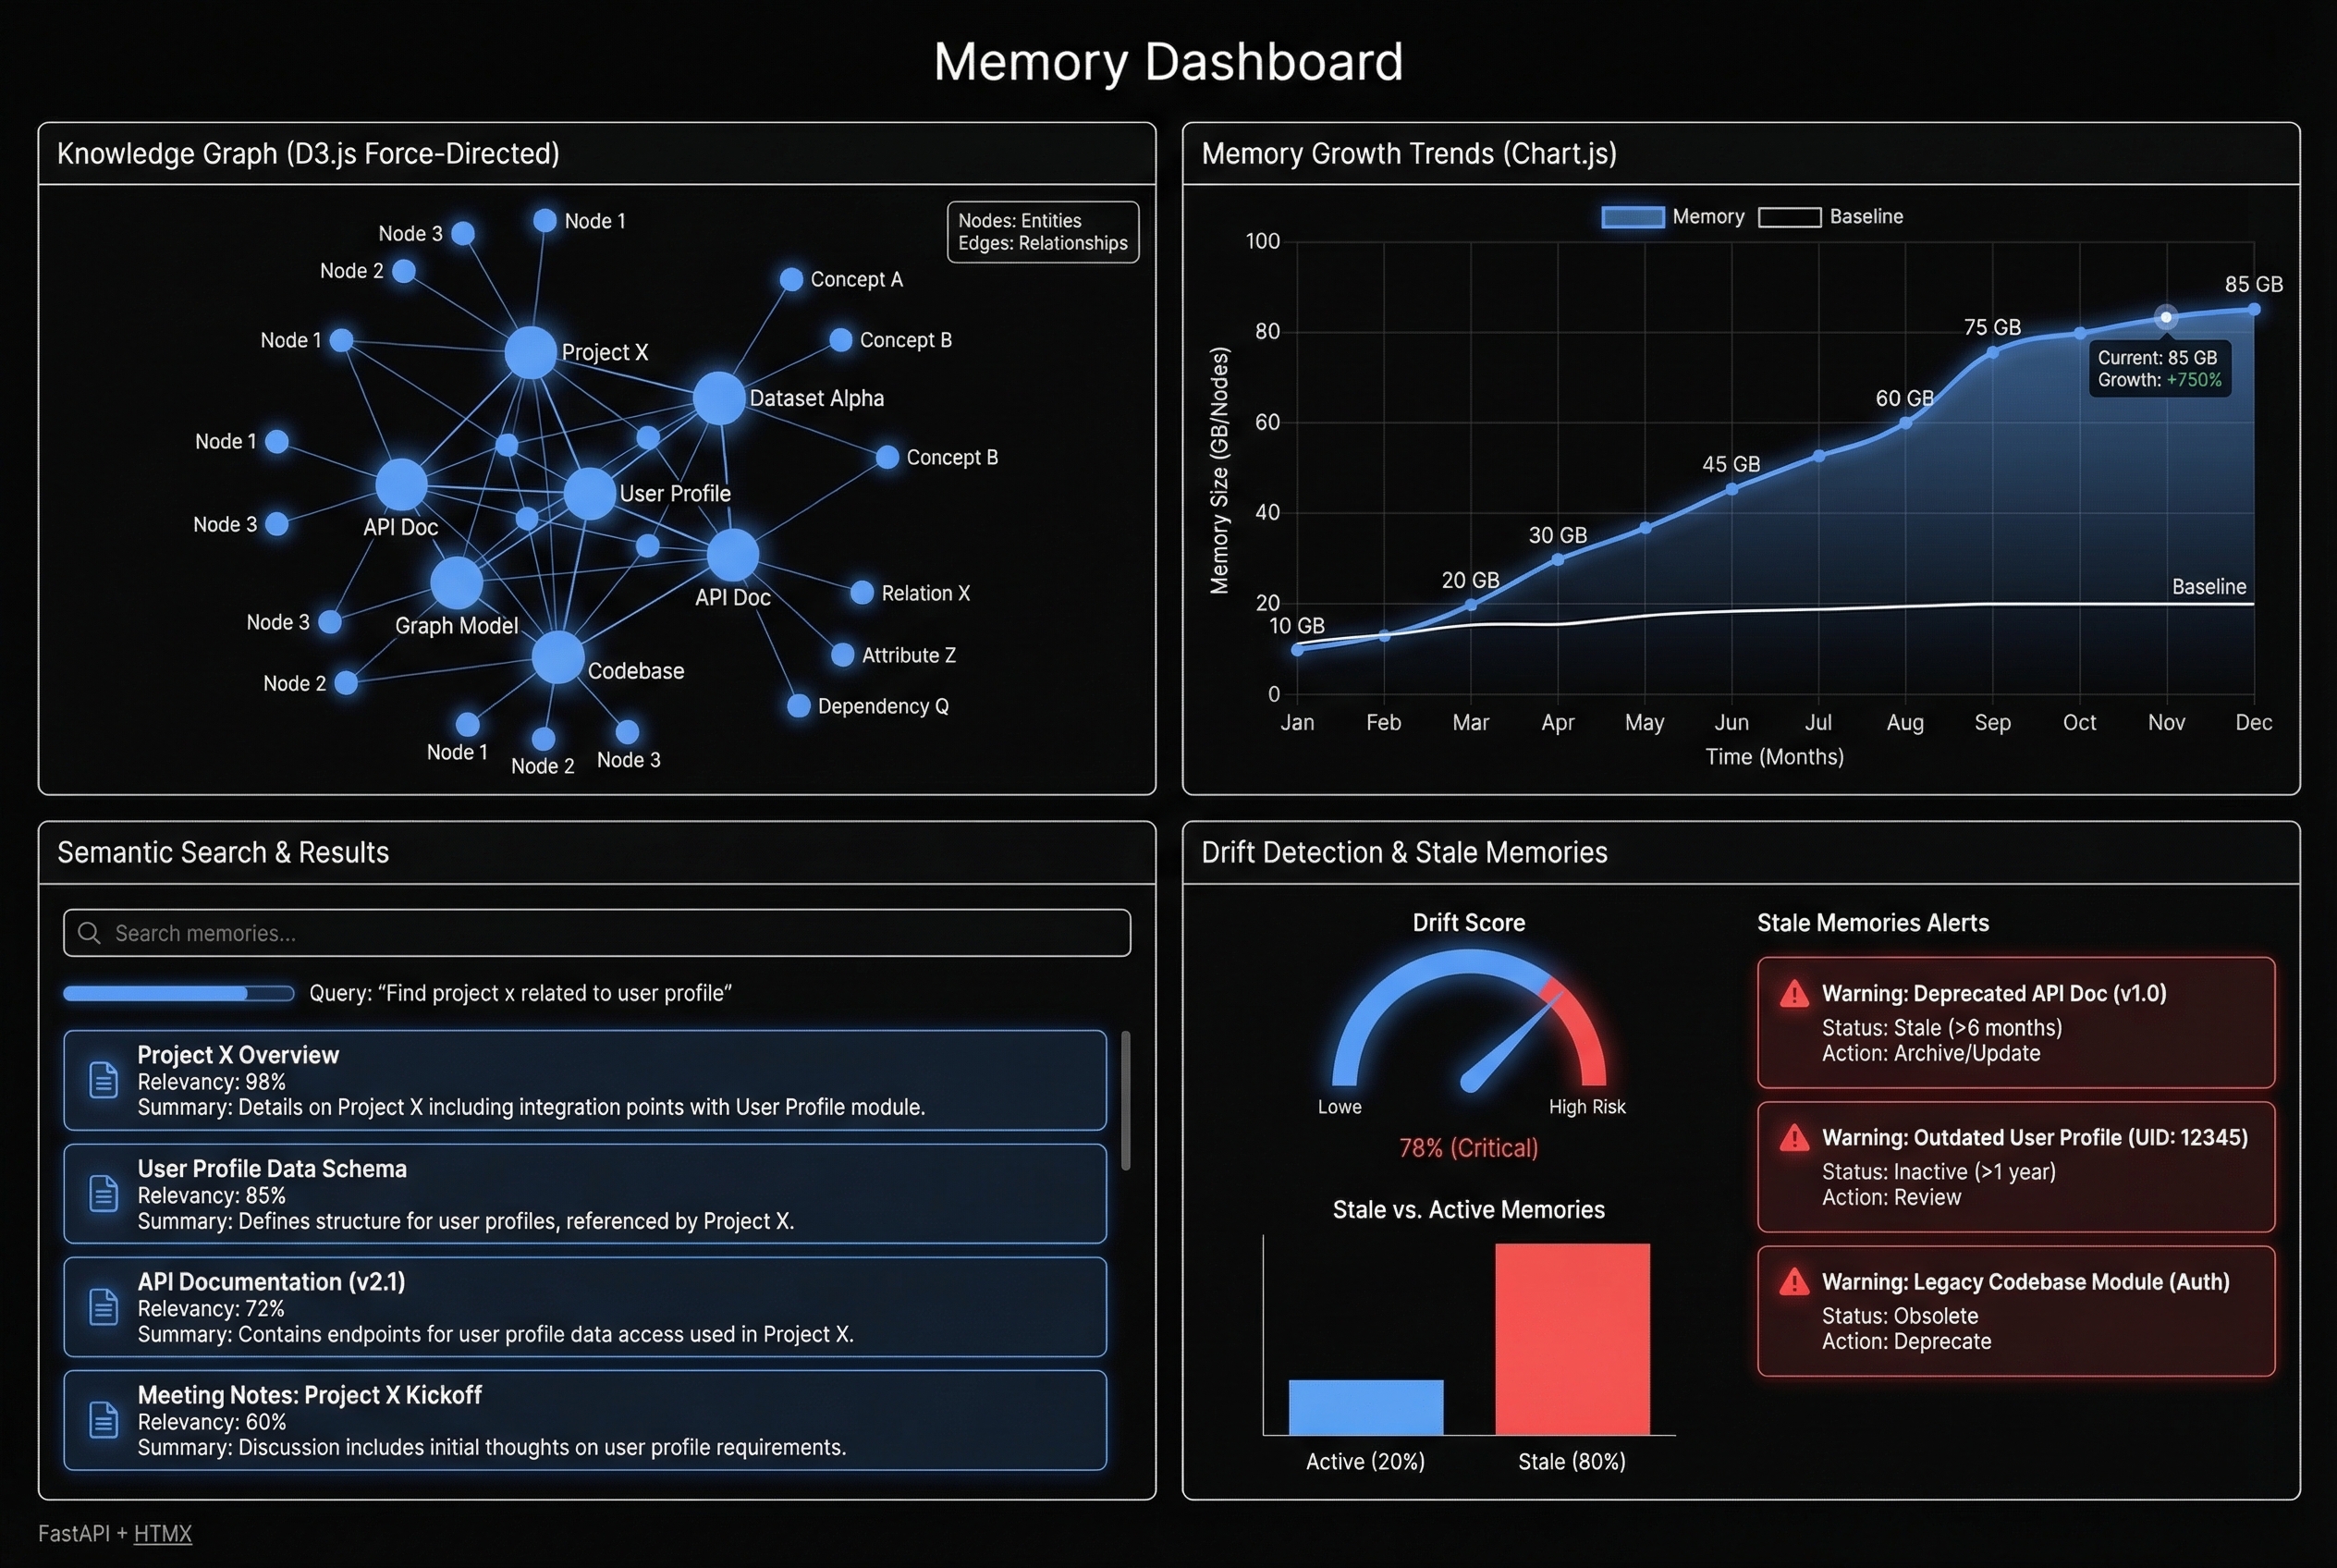
Interactive force-directed visualizations that map relationships between memories. Nodes represent individual memories, edges represent semantic similarity. Click any node to inspect its content, metadata, and linked memories. Filter by collection, date range, or similarity threshold.
Query your agent's knowledge by meaning, not just keywords. Type "deployment process" and find memories about CI/CD pipelines, release gates, and environment promotion — even if they never use the word "deployment." Powered by the same embedding model your agents use for recall.
Automated analysis identifies three types of drift: stale memories that haven't been recalled in 90+ days, contradictory memories where two entries conflict, and decaying memories where confidence scores drop below threshold. Each flagged memory includes a recommended action.
Track health metrics across all memory collections: total count, average embedding quality, recall hit rate, and storage utilization. Each collection — user, feedback, project, reference, trajectory, procedure — gets its own health score and growth trend line.
Trend visualization for memory growth over time, recall frequency by collection, storage consumption by type, and deduplication effectiveness. Line charts, bar charts, and doughnut breakdowns — all updating in real time as agents store and recall memories.
Server-rendered HTML with real-time partial updates — no JavaScript framework overhead. HTMX handles dynamic content swaps: search results stream in as you type, graphs update on filter changes, and drift alerts appear without page reloads. Sub-100ms response times on the FastAPI backend.
Most agent memory systems are black boxes. Memories go in, and sometimes they come back out — but you have no visibility into what's stored, whether it's accurate, or if it's even being used. When an agent makes a wrong decision based on stale knowledge, you don't know until the damage is done.
The Memory Dashboard makes agent knowledge observable. You can see the knowledge graph growing in real time, identify contradictory memories before they cause errors, and track which collections are healthy versus degraded. Drift detection catches problems proactively — flagging a memory that says "use Python 3.9" when a newer one says "use Python 3.12."
For teams running multiple agents across projects, the dashboard provides the operational visibility that turns AI memory from a liability into an asset. You're not just storing knowledge — you're managing it.